Water supply and sanitation in Belgium
Another 100 mostly small municipalities provide services directly without having a legally of financially separate entity for water supply.
Water is not scarce in Belgium and water supply is generally continuous and of good quality. However, wastewater treatment has long lagged behind and Brussels only achieved full treatment of its wastewater in 2007.
In 2004 the European Court of Justice ruled condemning Belgium's failure to comply with the EU wastewater directive, and the ruling has not been fully complied with so far. Wallonia satisfies 55% of the national needs in drinking water while it counts only 37% of the population. Flanders and Brussels are dependent on drinking water from Wallonia, at a level of 40% and 98% respectivelely.
An interesting aspect of the Belgian water and sanitation sector is the recognition of a basic right to water.
The Walloon and Brussels Regions have set up Social Funds for Water, which provide financial support to people having difficulties to pay their water bill, while in Flanders everyone has the right to a minimal supply of 15 m³ (41 liter/capita/day) of free water per person per year.
The average water tariff in Belgium for large users in 2008 was Euro 2.92 per cubic meter, the second-highest among 14 industrial countries compared in a recent survey. Between 2003 and 2008 water tariffs in Belgium had increased by 80%, the highest increase in that period among all 14 countries.
Water resources
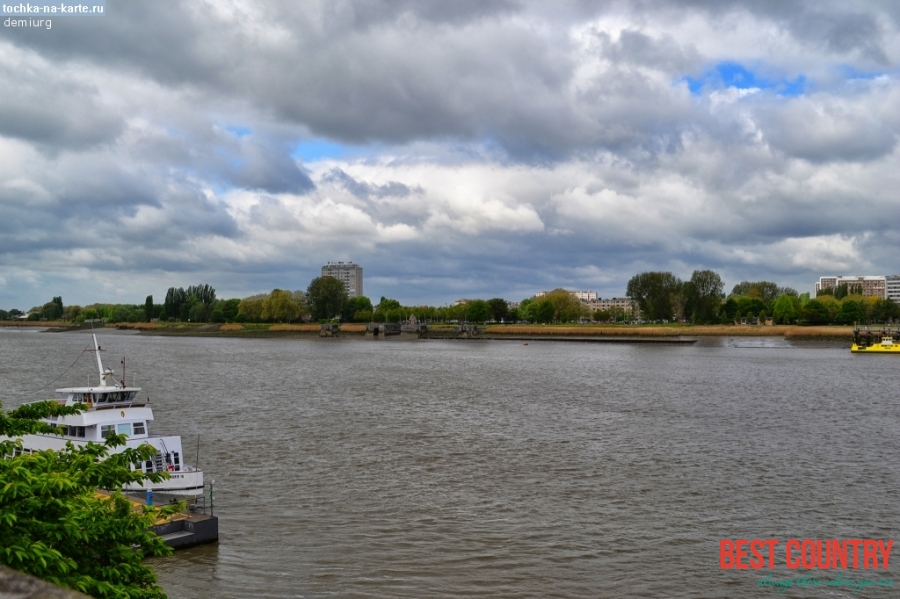
The Maas River, shown here at Namur, is one of Belgium's main water resources. The river provides 30% of Brussel's water supply.
Belgium’s water resources are distributed among five river basins, the two main ones being the Maas River (known in French as Meuse) and the Scheldt (known in French as Escaut) that both take their source in France and flow into the sea in the Netherlands.
The major aquifers are located in Wallonia. Belgium does not face water stress, despite its high density of population. Internal water availability is around 12,000 Mio m³/year (average 1990-2004), or 1,168 m³/capita/year.
The yield of groundwater is around 900 Mio m³, exploited at a rate of 75%. This picture hides strong regional disparities, with the North dependent from the South. Wallonia satisfies 55% of the national needs in drinking water while it counts only 37% of the population. Flanders and Brussels are dependent on drinking water from Wallonia, at a level of 40% and 98% respectively.
The picture is complicated by the strong dependence of the Netherlands on the water of the Maas for its drinking water productionDrinking water production withdraws 707 Mio m³ in 2005 (10% of the total withdrawals), 65% produced from groundwater, often distributed without prior treatment, and 35% from surface water, more expensive to produce.
For example, Brussels receives its water from springs, groundwater and the Maas River, all located in the Walloon region. Modave in the Hoyoux valley, located more than 100 km Southwest of Brussels, produces about 20% of the capital's water supply from galleries in the hills surrounding the valley.
In Mons surface water from the Maas is treated to provide another 30% of the city's water needs; in Vedrin, part of Namur, water is pumped from an abandoned Pyrite mine; springs in Genappe, wells in Waterloo and Zaventem, and mines in Ligny and Écaussinnes provide the remainder of Brussel's water supply. The city of Antwerp is supplied with water from the Albert Canal. The city of Liège is supplied from wells pumping from the Hesbaye aquifer.
Distribution losses are estimated at 13%. According to some sources residential water consumption was 106 liter/capita/day,[8] while other sources say it was 135 liter/capita/day in 2003, down from 171 liter/capita/day in 1995.